|
Final Presentations
My presentation: https://docs.google.com/presentation/d/18C8_wkLW3MQC0U635KZ9VFg2SsXdxNAoqMDDkdS2WcY/edit?usp=sharing
0 Comments
Continued working on the water data analysis. Refined the calculations and added how much water was used per person per day. Finally, wrote the data to two excel spreadsheets.
Once the data analysis was finished, I worked on and finished my one page reflection and the presentation. Note: I was not present for day 6 On the third and fourth day we used pandas to do data analysis on the town's water consumption. The idea for the project was to take the town's data and write a program to answer a few questions:
I tackled this problem by creating a dataframe in PANDAS using the given data, grouping it by address, and creating two new dataframes to store the results. The first dataframe stored the data for each household. I took the last reading, subtracted the first reading, divided by the time difference in days between the two readings, and then converted the final result to gallons. Similarly for each street, I took the sum of the average water usage for all the buildings on each street and divided by the total number of buildings. The results for this were stored in another dataframe. The code and results are pictured below: Code - 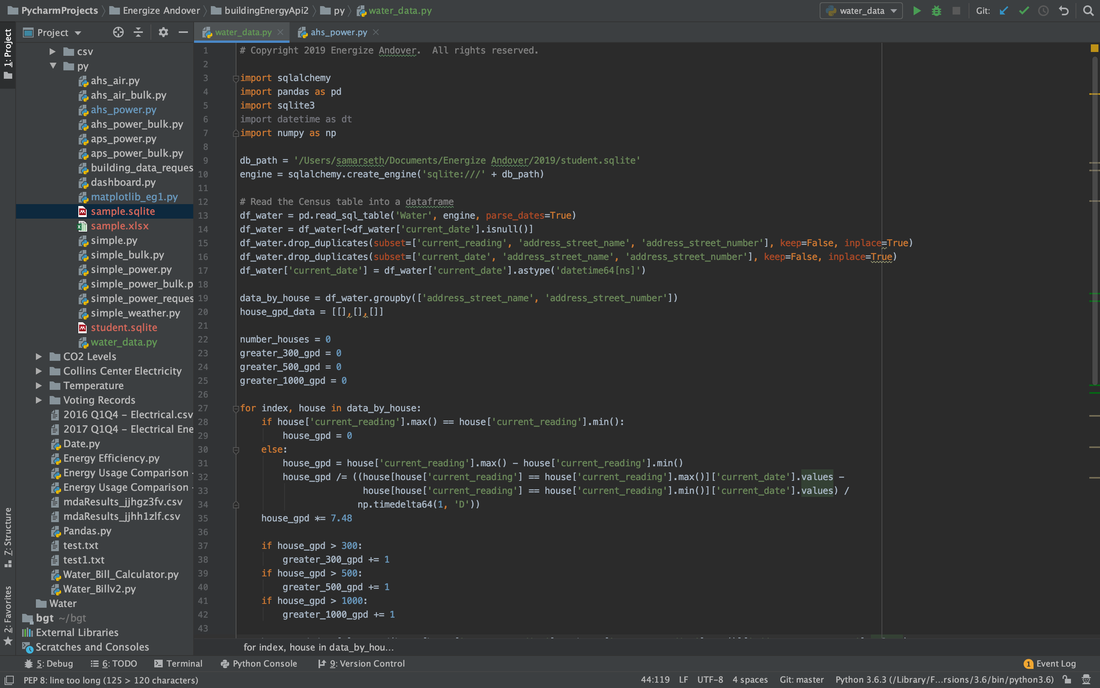 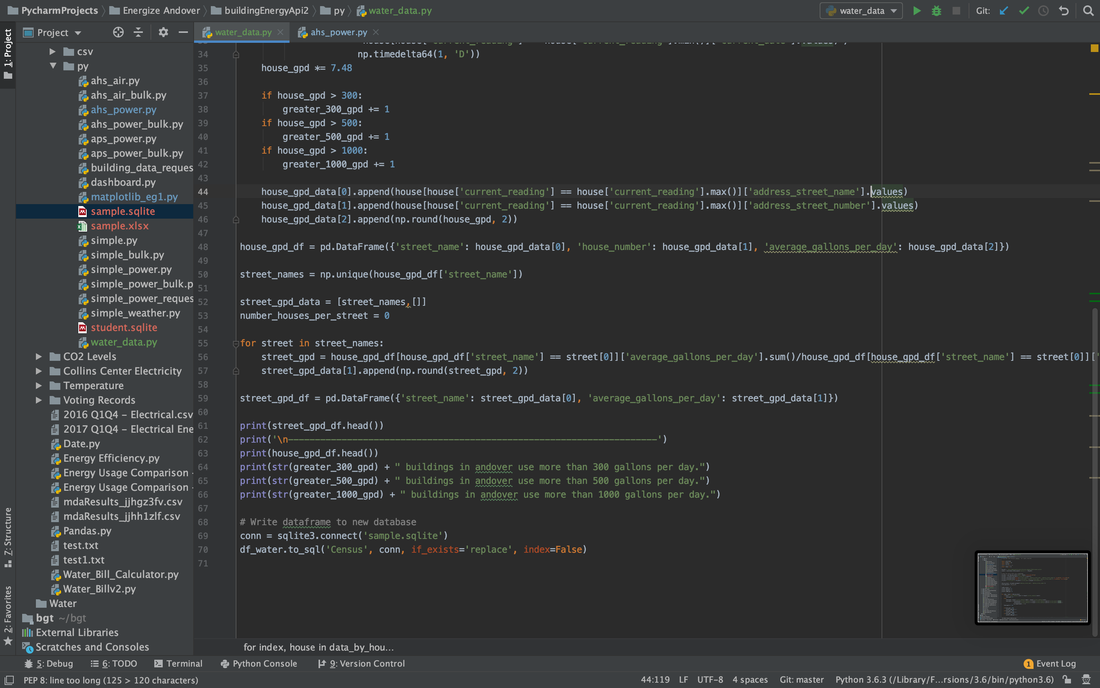 Output - 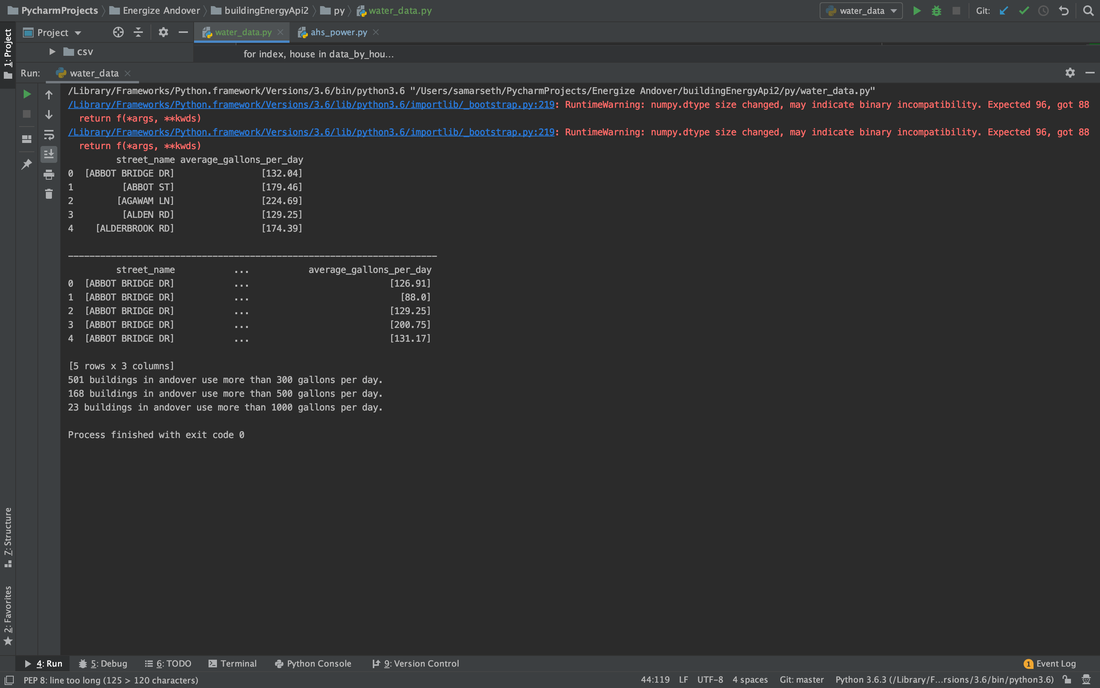 On the second day we continued working with matplotlib to create a graph that could retrieve energy data from Andover High School and update it in real time. We started with just attempting to create a graph with one "line" of data before trying to figure out how to graph multiple streams of data at once. With just one data source, however, the final product looked like the following: 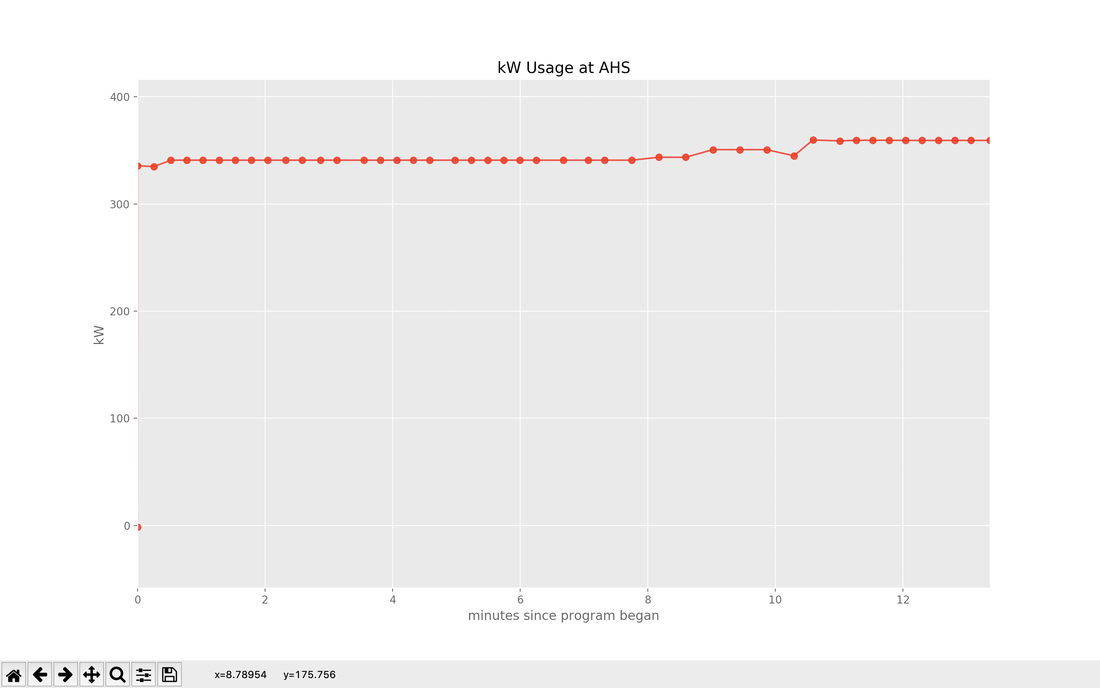 Source code: 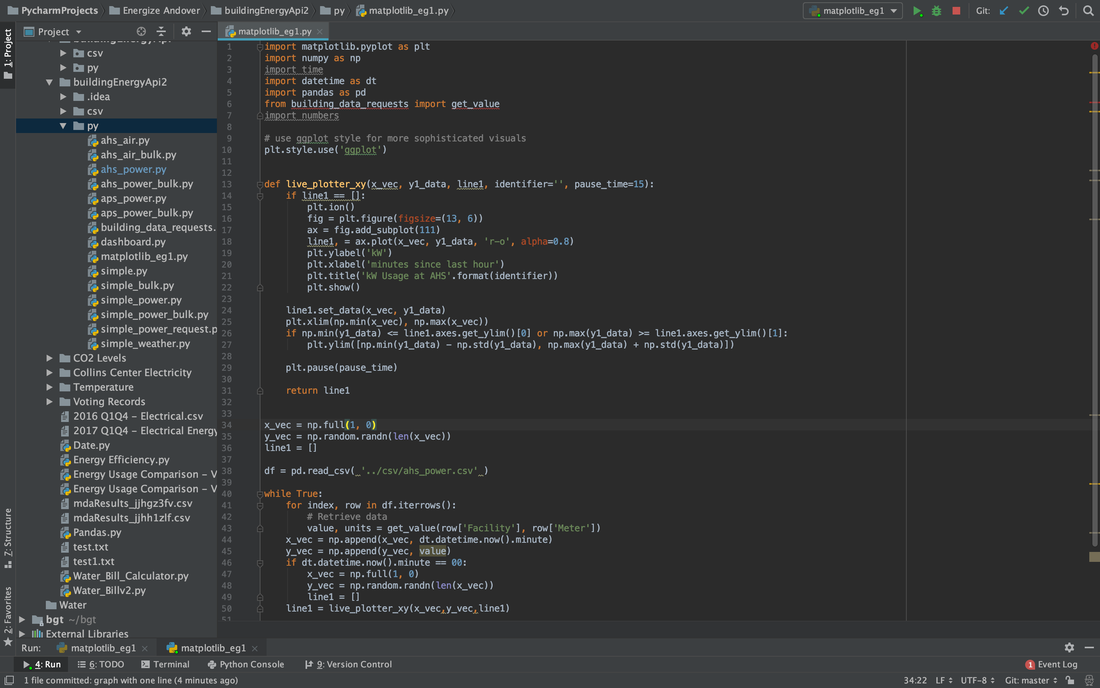 For our first meeting of the 2019 bootcamp we started with a some review of PANDAS, python, and BACNET protocols. Our only assignment for the day was to retrieve data from andover high school about it's energy usage. For homework, we were told to experiment with the matplotlib python library and use it to create a graph of the energy usage at andover high.
Day 7 of Summer Camp
Today we worked on finished our dashboard. Day 6 of Summer Camp
Today we decided to compare the energy usage data of Andover High School and Phillips Academy Andover on a year by year basis before continuing the work on our dashboard. Day 5 of Summer Camp
Today we continued our work designing a new dashboard and attempted to begin writing the code to make said dashboard. We also discussed voltage, amperes, watts, and their relationship with one another (W = V * I). While discussing this, Mr. Navkal thought it might be useful to look at a transformer and we observed that the excess energy that was being released was making the room hotter because it was being released as heat. Day 4 of Summer Camp We began the fourth day by discussing what we thought was cool out of the material we have covered so far and what we enjoyed and would like to do more of. After this introduction, we watched a Ted Talk which exposed how personal bias, outdated information in schools, and news bias causes ignorance and large scale misconceptions about the state of the world. We also looked at some interesting ways to visualize data at: https://www.gapminder.org/tools/#$state$marker$color$which=co2_emissions_tonnes_per_person&use=indicator&scaleType=genericLog&spaceRef:null;;;&chart-type=bubbles From this we moved on to looking at the current Dashboard for the BACnet Gateway and discussing the pros and cons of its design. We began brainstorming how we could improve the dashboard so that students in the high school would be motivated to look at the dashboard at least close to daily in order to be aware of the school's energy usage and try to reduce it. Figure 1 shows a few of the ideas that we came up with. 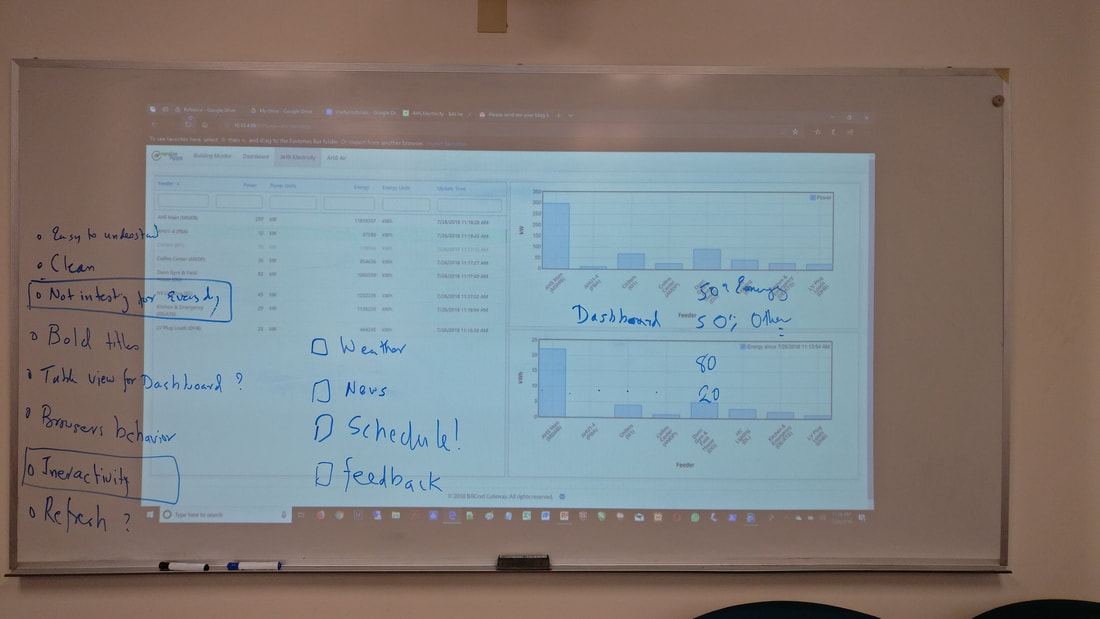 Figure 1 Day 3 of Summer Camp We began our third day by refining our code from the previous day. We rewrote it to exclude weekends so that it would be more accurate as to the CO2 levels during only school hours. Afterwards, we looked at another factor which could make people uncomfortable in the high school, high temperatures. To solve this problem, we wrote a code which compiled the rooms which averaged a temperature above 75 degrees Fahrenheit during school hours in the month of June. We also wrote code to analyze how much energy from the school was being used by the Collins Center year to year and how this affected the cost as well. Near the end of our third day we were given a presentation on the energy consumption in the town of Andover from Janet Nicosia. Specifically, we talked about the Solar Panels which produce electricity for the town buildings in Andover. We also looked at a graphic which demonstrates how electricity is typically consumed and produced by solar panels over a one year period (Figure 1 pictured below) before looking at Andover's electricity bill for last month (Figure 2 pictured below). The town used about $58,956 worth of electricity and the solar farm produced about $101,217 worth of electricity. 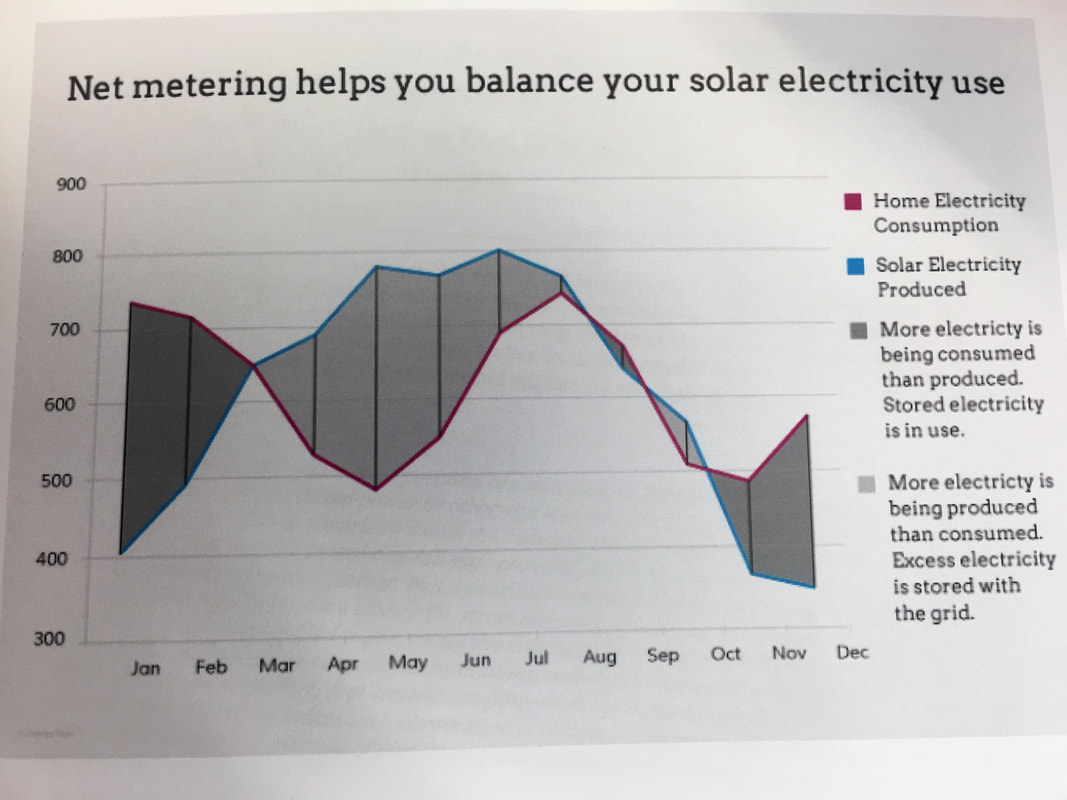 Figure 1  Figure 2 Day 2 of Summer Camp
Today we talked about how the Metasys Data Analysis web app works and BACnet protocol. More specifically we looked at objects, object methods, and attributes as well as how the BACnet protocol works to obtain values for certain attributes of said objects. We also wrote code which took data from a csv file concerning CO2 levels in AHS and found all the rooms where the CO2 levels were above 1000 during school hours. Day 1 of Summer Camp
On the first day of the summer camp we began our discussion about energy by looking at real time data of energy consumption and power usage in the Andover Public schools. We also discussed how much energy is wasted every day. For example, in the summer, when the school should be closed, Andover High School uses $0.50 worth of electricity every minute. Afterward we attempted to obtain real time data using python and log that into a csv file which we could then use as an excel spreadsheet or upload to Energize Andover's data analysis web app in order to analyze the data. In order to practice and add on to our knowledge of Pandas Mr. Navkal asked Ayush and I to make a more logical code with single script with input/output. We used a bunch of tutorials and resources that Mr. Navkal provided us with in order to come up with the following code:
import pandas as pd class EnergyAnalysis: def __init__(self, csv, column, column2): self.csv = pd.read_csv(csv) self.csvName = csv self.column = column self.column2 = column2 def setCsv(self, csv): self.csv = pd.read_csv(csv) def setColumn(self, column): self.column = column def setColumn2(self, column2): self.column2 = column2 def getCsv(self): return self.csvName def getColumn(self): return self.column def getColumn2(self): return self.column2 def sumCompare(self): column1sum = self.csv[self.column].sum() column2sum = self.csv[self.column2].sum() result="" if column1sum > column2sum: columnDifference = column1sum-column2sum result="Sum of all values in " + self.column + " is " + str(column1sum) +". Sum of all values in " + \ self.column2 + " is " + str(column2sum) + ". Sum of all values in " + self.column + \ " is greater than the sum of all values in " + self.column2 + ". " + self.column + \ " is greater than sum of " + self.column2 + " by " + str(columnDifference) elif column2sum > column1sum: columnDifference = column2sum-column1sum result="Sum of all values in " + self.column + " is " + str(column1sum) + ". Sum of all values in " +\ self.column2 + " is " + str(column2sum) + ". Sum of all values in " + self.column2 + \ " is greater than the sum of all values in " + self.column + ". " + self.column2 + \ "is greater than sum of " + self.column + " by " + str(columnDifference) elif column1sum == column2sum: result="Sum of all values in " + self.column + " is " + str(column1sum) +". Sum of all values in " + \ self.column2 + " is " + str(column2sum) + ". Sum of all values in " + self.column + \ " is equal to the sum of all values in " + self.column2 + "." return result def avgCompare(self): column1avg = self.csv[self.column].mean() column2avg = self.csv[self.column2].mean() if column1avg > column2avg: columnDifference = column1avg-column2avg return "Average of " + self.column + " is " + str(column1avg) + " and average of " + self.column2 + \ " is " + str(column2avg) + ". Average of " + self.column + " is greater than " + self.column2 + \ " by " + str(columnDifference) elif column2avg > column1avg: columnDifference = column2avg - column1avg return "Average of " + self.column + " is " + str(column1avg) + " and average of " + self.column2 + \ " is " + str(column2avg) + ". Average of " + self.column2 + " is greater than " + self.column + \ " by " + str(columnDifference) elif column2avg == column1avg: return "Average of " + self.column + " is " + str(column1avg) + " and average of " + self.column2 + \ " is " + str(column2avg) + ". Average of " + self.column2 + " is equal to " + self.column def totalCompare(self, filename): file = open((filename+".txt"),"w") file.write(self.sumCompare()) file.write("") file.write(self.avgCompare()) file.close() print("Exiting totalCompare") test = EnergyAnalysis("2016 Q1Q4 - Electrical.csv", "HS-Kitchen Emergency (kWh)", "HS Main (kWh)") test.totalCompare("test1") print("Done") Ayush and I got back together and started to work on our project for this Summer. For our first mission
our goal was to:
Mr. Navkal advised us to use PANDAS, a data analysis tool, in order to find the answers to these questions. He gave us a site from which we could access the necessary data as long as we were on the town wi-fi. The following was our code that we wrote in order to solve these questions: import pandas as pd # 2016 EnergyUsage2016 = pd.read_csv("2016 Q1Q4 - Electrical.csv") print("2016") sumOfEnergyUsage2016 = EnergyUsage2016.sum() print(sumOfEnergyUsage2016) print() print() HS2016kWh = EnergyUsage2016['HS Main (kWh)'].sum() + EnergyUsage2016['HS DHB Plugload (kWh)'].sum() + \ EnergyUsage2016['HS DL Lighting (kWh)'].sum() + EnergyUsage2016['HS-Kitchen Emergency (kWh)'].sum() + \ EnergyUsage2016['HS DG Gym (kWh)'].sum() + EnergyUsage2016['HS M1 Chillers (kWh)'].sum() + \ EnergyUsage2016['HS CC (kWh)'].sum() CollinsCenter2016 = EnergyUsage2016['HS CC (kWh)'].sum() PercentUsage2016 = CollinsCenter2016/HS2016kWh * 100 print("Energy used in 2016 by AHS was " + str(HS2016kWh) + " kWh.") print("Energy used in 2016 by the Collins center was " + str(CollinsCenter2016) + " kWh.") print("The Collins Center contributed " + str(PercentUsage2016) + "% of AHS's total energy consumption in 2016.") print() print() print() print() # 2017 EnergyUsage2017 = pd.read_csv("2017 Q1Q4 - Electrical Energy Daily.csv") print("2017") sumOfEnergyUsage2017 = EnergyUsage2017.sum() print(sumOfEnergyUsage2017) print() print() HS2017kWh = EnergyUsage2017['HS Main (kWh)'].sum() + EnergyUsage2017['HS DHB Plugload (kWh)'].sum() + \ EnergyUsage2017['HS DL Lighting (kWh)'].sum() + EnergyUsage2017['HS-Kitchen Emergency (kWh)'].sum() + \ EnergyUsage2017['HS DG Gym (kWh)'].sum() + EnergyUsage2017['HS PBA AHU1- 4 (KWh)'].sum() + \ EnergyUsage2017['HS M1 Chillers (kWh)'].sum() + EnergyUsage2017['HS CC (kWh)'].sum() + \ EnergyUsage2017['HS Gas (100 Cu Ft)'].sum() * 29 CollinsCenter2017 = EnergyUsage2017['HS CC (kWh)'].sum() PercentUsage2017 = CollinsCenter2017/HS2017kWh * 100 print("The amount of energy used in 2017 by AHS was " + str(HS2017kWh) + " kWh.") print("The amount of energy used in 2017 by the Collins center was " + str(CollinsCenter2017) + " kWh.")print("The Collins Center contributed " + str(float(PercentUsage2017)) + "% of AHS's total energy consumption in 2017.") During this summer, I did a lot of new, interesting things. I enjoyed learning about where energy comes from. I never realized before how much energy is wasted to make electricity. My favorite part was the programming that we did in order to calculate our water bill, solar efficiency, etc. This experience has certainly given me a lot, but I feel as though there is still a lot left to learn. I hope to do a lot more programming and perhaps do some more mechanical work in the electrical field.
In our 9th meeting, we went over the code that Ayush and I had each written that calculated a person's water bill based on their water usage. After this, we talked about the benefits of solar energy and how it can reduce one's carbon footprint to nothing. When creating electricity, you have to use therms to power a boiler. From that boiler, you take the energy produced and use a generator to create the electricity. The electricity goes through transformers and other channels for the transmission and distribution of it until it finally reaches your home for usage. Normally the end to end efficiency of this process is about 17%, although it varies slightly. Conversely with solar, there is little to no loss of energy. This means that if you create 7700 kWh of energy through solar, you are saving about 1600 therms of energy which would be used in a boiler to create that same amount of energy. And if you then use 1600 therms or less to heat your house, your net carbon footprint is nil. By using solar, you not only help the environment, but save money as well.
In our 8th meeting, we started off by learning some basic trigonometric functions and identities. These are as follows:
Basic Trig Functions
We also graphed the sin(x), sin(x+120), and the sin(x-120) to learn how sin curves and three phase electricity work. In our 7th meeting, we learned about the water distribution system in Andover. The water is taken from the Merrimack River and goes to the Fish Brook Pump Station. From there, it goes to Haggets Pond, where it is pumped to two different places, the Woodhill Tank and the Bancroft reservoir, via the Westside pumps and the Bancroft pumps respectively. The Woodhill Tank provides water for half the town and the water Bancroft reservoir goes to the Prospect Hill Tank, which supplies the other half of the town.
After this, we learned how to do calculations on google sheets and how to automate a series of spreadsheets so that changing any data points on one will change the data points on the others. We also calculated how much our water bill would come out to be for the amount of water that we use based on the town billing system. We then calculated how much the cost of water per person would be in each of our houses. On our 6th meeting, Mr. Navkal showed us how to use google maps to measure the distance between places. This way we could compare the distance between places by road and as the bird flies. After this he showed us how to use Geo Sheets to create our own custom maps with places of interest. Using Geo Sheets we learned how to have our own color, icon, and name for each of the locations that we wanted to put on the map.
In our fifth meeting with Mr. Navkal, we talked about the cost of water for the town and for us. The town pays $480 per million gallons of water and they charge us approximately $4264 per million gallons of water. We pay nearly ten times as much as the town to get clean water, but it is still quite cheap in comparison with electricity and gas.
Next, we discussed how leaks and meter errors affect the finances of the town. It costs the town x dollars to pump a certain amount of water. Along the way from the water treatment plants to our faucets, lets say that 24% of that water is lost, 60% of that because of a leak from the pipes and 40% because of meter errors. These leaks and meter errors increase the cost for the town but the meter errors also cause a fairly significant amount of lost revenue over time. This means that meter errors will be ten times more expensive than pipe leaks because there is lost revenue on top of the increased cost for pumping the water. In our fourth meeting, Mr. Navkal taught us how to do some unit conversions for the data we collected from the meters in our houses. We learned how to convert Watt hours into kilocalories (1 Wh = .860421). We also learned that 1000 calories = 1 kilocalorie/Calorie. To do similar conversions for the water and gas meters, we found that 1 cubic foot of water/gas is the same as 7.48052 gallons. With this information, we converted our units for our data table. An interesting fact that these unit conversion formulas revealed was that a 100 watt bulb running for 24 hours uses about the same amount of energy as a human uses in the same time period. This just goes to show how efficient the human body is.
In addition to this, we analyzed our gas bills. We found that 100 cubic feet of gas is equal to 1 ccf worth of gas or approximately 1.029 therms. From this we figured out that each therm costs $1.24. In contrast to this 1 killowatt hour costs $0.21. However, 1 therm is the equivalent of 29.3 kWh's, which would cost $6.15. This means that electricity is about 5 times less efficient than natural gas. We also looked at the average water use per day in several countries. In the US, the average household uses approximately 152 gallons per day. In stark contrast to this the stats for Africa are 5.28 gallons per day, for China it's 19 gallons per day, in France it's 76 gallons per day, and in India it's 36 gallons per day. Looking at these stats makes you realize that the things you take for granted may not be available as readily to those less fortunate than you. During our third meeting, we looked at the meters in Mr. Navkal's house. These include the water meter, gas meter, and electricity meter. While experimenting with the water meter, we found that a small leak will not be registered by the meter, meaning that the town pays for that wasted water. However, you can almost always hear a leak through the pipes. If the water meter is moving as well, then you know it is a big leak. The faster it moves, the bigger the leak. For the electricity meter, we learned that there are two types of electrical meters, digital and analog, and it shows your electricity usage in kWh. The water and gas meters on the other hand, are measured in cubic feet. The gas meter is very complicated; there are 6 ways to turn the gas off in the house! We also learnt that on the road outside the house, there are yellow markings that show where the gas main is to your house. This means that if there is a fire, the fire department can turn off the gas supply to the house from outside so there are no explosions. There is also a similar marking for the water main, which is there in case of a flood. This blog post was written in collaboration with Ayush Zenith.
For every 100 kWh of energy put into a generator, only 40 kWh can be used. This was the first thing we learnt in today's meeting with Mr. Navkal. This means that there is a 60% loss of energy in the form of heat. We also learnt a few conversion rates between sources of energy and kWh: 1 ton of coal = 8141 kWh, 100 mW = 100000 kWh = 12.28 tons of coal, 5000 mW = 614.18 tons of coal, and 1 gallon of gas = 35 kWh. Since we learnt that a generator produces 2000 mW of energy per hour, we know that they use 5000 mW of energy every hour to create that 2000 mW of electricity. Based on this data, we can calculate how much coal will be needed to power our houses per month and per year. In addition to this we learnt that one train carries approximately 15,000 tons of coal. This means that nearly one full train’s worth of coal is used every day by a single generator (24 • 614.18 = 14740.32). And if not coal, then the generator is using natural gas or nuclear energy. Going into today's session, I though that a house would obviously use more energy than a car, but I could not have been more wrong. Since 1 gallon of gas creates 35 kWh of energy, cars use about 525 kWh of energy per week at a rate of 15 gallons consumed per week. In comparison, the average house uses 600-700 kWh of energy in a month. This means that one car uses about 4 times as much energy as a house. We also learnt how much electricity is used by many products that we use in our everyday life.(i.e. Laptop, TV, and convection oven). The most astounding one was the Oven which used 533 Watts, then came the tv with 166 Watts, and last came the laptop which used 69 Watts. This blog post was written in collaboration with Ayush Zenith.
In my first meeting with Mr. Navkal, we looked at the energy efficiency of different kinds of lightbulbs. The first thing we talked about were the different units used to measure the energy usage of an object. These units include Watts, Volts, and Amps. In order to measure these we used a multimeter and we learned a few formulas relating to these units. These formulas were: V • I = W and I • R = V. In these equations V means volts, I means amps, W means watts, and R means ohms. To begin our session we tested halogen light bulbs, CFL light bulbs, and LED light bulbs for their energy efficiency. Of the three, LED was the most efficient. The halogen light bulb used 117.8 volts, the CFL light bulb used 59.4 volts, and the LED bulb used only 9.8 volts. We also used both digital and dial calipers to measure the width of the plug end of the light bulbs. We found that one side of the plug was 0.32 inches and the other side was 0.25 inches. We also found that the electricity only traveled through the smaller side of the plug. Another thing we looked at was the outlet itself. We found out that most modern outlets are tamper resistant so that babies won’t get electrocuted by sticking things in the outlet. We also looked at what the control panels for the electricity in the house look like and what the circuit breakers within them control. We talked about what the numbers and labels on the panels mean. In addition, we looked at how solar panels can create enough energy to make a house completely self-sufficient and even send extra electricity back into the town grid. This blog post was written in collaboration with Ayush Zenith.
|
 AuthorSamar Seth is a high schooler who is looking for opportunities to expand his horizons such as internships at unique companies. He is currently interning at a company called Energize Andover, the subject of this blog.  |
